clc;
clear all;
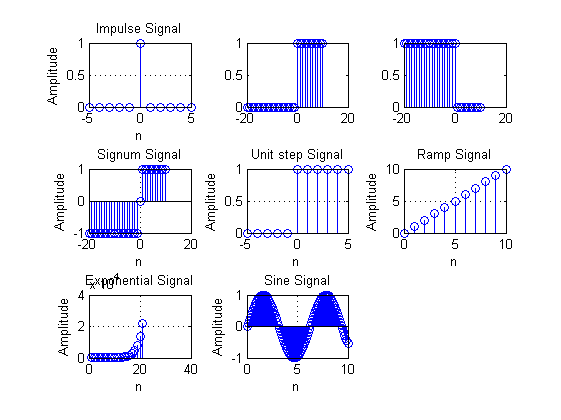
n=-5:1:5;
y=[zeros(1,5),ones(1,1),zeros(1,5)];
subplot(3,3,1);
stem(n,y);
xlabel('n');
ylabel('Amplitude');
title('Impulse Signal');
grid on;
n=-20:10;
x_n1=n>=0;
subplot(3,3,2);
stem(n,x_n1);
x_n2=n<=0;
subplot(3,3,3);
stem(n,x_n2);
sgn_n=x_n1-x_n2;
subplot(3,3,4);
stem(n,sgn_n);
xlabel('n');
ylabel('Amplitude');
title('Signum Signal');
grid on;
n=-5:1:5;
y=[zeros(1,5),ones(1,6)];
subplot(3,3,5);
stem(n,y);
xlabel('n');
ylabel('Amplitude');
title('Unit step Signal');
grid on;
n=0:1:10;
y=n;
subplot(3,3,6);
stem(y,n);
xlabel('n');
ylabel('Amplitude');
title('Ramp Signal');
grid on;
x=0:0.5:10;
z=exp(x);
subplot(3,3,7);
stem(z);
xlabel('n');
ylabel('Amplitude');
title('Exponential Signal');
grid on;
t=0:0.1:10;
x=sin(t);
subplot(3,3,8);
stem(t,x);
xlabel('n');
ylabel('Amplitude');
title('Sine Signal');
grid on;